observabilityaikubernetesgpuprometheusgrafanaopentelemetryopensource
Your Kubernetes Cluster Is Running AI Models. But Can You Tell Me Why It Broke in the Middle of the Night?
Go on, take a second. I'll wait.
If you hesitated, you're in good company. Across teams running AI workloads on Kubernetes, observability is the gap that gets papered over: fifty metrics, ten panels, and no clear picture of what's actually wrong.
So let's talk about that.
Why AI Workloads Rely on Kubernetes
Kubernetes has won. CNCF's annual surveys put enterprise adoption above 85%, and the share of those clusters running AI/ML workloads has crossed the halfway mark and is still climbing.
The reason is practical: AI workloads need GPU scheduling, distributed training coordination, autoscaling, and resource isolation — and Kubernetes handles all of it natively. The ecosystem around it — KubeFlow, Ray, Volcano, and KEDA — has matured to match.
The problem is that AI workloads are fundamentally different from the web services Kubernetes was built around.
Traditional apps have predictable resource profiles and failure modes you can write a runbook for.
Your AI workload?
- Spiky GPU demands
- Bursty training jobs
- Model drift that degrades silently over weeks
- Outputs where "correct" is a probability, not a status code
It's like trying to monitor a Formula 1 car with a dashboard created for a 2009 Honda Civic.
Here's the full picture — every layer that has to be healthy, and every layer that has to be instrumented:
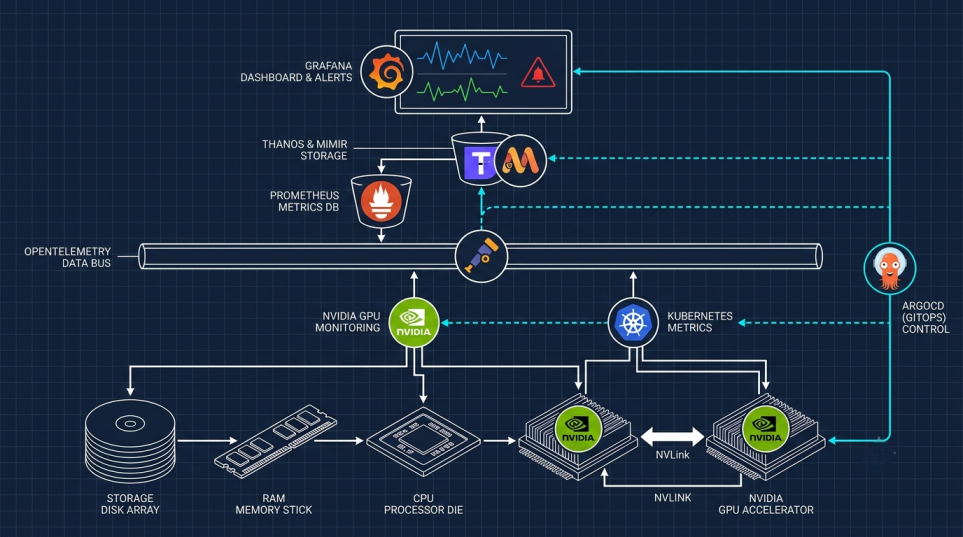
The data path runs bottom to top: hardware emits counters, exporters collect them, OpenTelemetry unifies them, Prometheus stores them, Thanos/Mimir keeps them, Grafana makes them legible. The GitOps rail on the right is what keeps every box above the hardware line reproducible — that's the layer KubeAid gives you pre-built.
Three Ways Observability Falls Apart for AI
1. You're Drowning in Data and Starving for Answers
AI workloads add:
- GPU SM utilisation
- Memory bandwidth
- NVLink throughput
- CUDA context switches
- Inference latency distributions
- Training loss curves
...on top of standard infrastructure metrics.
That's roughly 10× the telemetry.
When inference latency jumps from 50ms to 500ms, your diagnostic tree spans:
- GPU saturation (
DCGM_FI_DEV_GPU_UTIL) - Memory bandwidth (
DCGM_FI_DEV_MEM_COPY_UTIL) - NVLink health (
DCGM_FI_DEV_NVLINK_BANDWIDTH_TOTAL) - Inference server back-pressure
- Upstream data pipeline issues
And standard tools rarely correlate any of it automatically.
2. Nobody Knows What "Broken" Looks Like
For a web service, failure is obvious:
- A
500 - A missed SLO
- A crash loop
For AI, it's often a slow probabilistic slide.
Model drift is statistically measurable:
- A Population Stability Index (PSI) above
0.25signals significant distribution shift - KL divergence tracks feature drift relative to the training baseline
But most teams haven't wired either into alerting.
They're still waiting for a customer complaint.
A model that's reliably 92% accurate beats one that averages 96% but silently degrades to 70%.
Stability is the product.
3. Your Monitoring Tool Is Competing With Your AI
Traditional agents often run:
300-500MBper node- As DaemonSets
- On the same GPU hosts as your workloads
That means competing with the workload you're observing for:
- Host memory
- PCIe bandwidth
- System resources
eBPF-based agents reduce this footprint to roughly one-fifth without sidecar injection.
NVIDIA's DCGM Exporter reads hardware counters directly and costs zero GPU compute.
Most legacy monitoring stacks haven't made either shift.
A 3 in the Morning Scenario
An eight-node A100 cluster runs an overnight training job.
At 2:47 AM, it silently stalls at 94%.
No alerts fire.
Pods are running. CPU and memory look fine.
At 6:15 AM, an engineer notices.
Four and a half hours of GPU time: gone.
Root Cause
NVLink on node 6 degraded to near-zero bandwidth, causing NCCL's all-reduce to time out on every collective step.
The training loop kept "running" — it was just waiting at the synchronisation barrier.
With GPU-Aware Observability
-
DCGM_FI_DEV_NVLINK_BANDWIDTH_TOTALdrops on node 6 at2:47 AM -
Throughput stall is automatically correlated
-
AlertManager pages within two minutes:
"Node 6 NVLink degradation — probable cause of training stall"
The job restarts on seven healthy nodes.
The NCCL timeout becomes a ticket.
Without It
You get:
- Forty-five minutes of log archaeology
- Eight-node SSH sessions
- A post-mortem full of:
- "we believe"
- "it appears"
- "likely caused by"
The gap isn't cleverness.
It's instrumentation.
What Good Looks Like — and How to Get There
Step 1: Lay the Right Foundation
Deploy:
nvidia/dcgm-exporteras a DaemonSet- Free
- Zero GPU compute cost
- 80+ hardware metrics into Prometheus
Add:
- OpenTelemetry Operator
- Unified traces, metrics, and logs
Replace heavyweight legacy agents on GPU nodes with eBPF-based alternatives:
- Parca
- Coroot
- Beyla
Put everything in Git:
- Scrape configs
- Alerting rules
- DaemonSet manifests
Apply via:
- ArgoCD
- Flux
Your observability config should be as reproducible as your application code.
Step 2: Define SLOs That Actually Mean Something for AI
| Signal | Target | Implementation |
|---|---|---|
| Inference latency p95 | < 100ms | Prometheus recording rule |
| Model accuracy | > 95% | Scheduled eval job → Prometheus gauge |
| Feature drift (PSI) | < 0.25/week | CronJob + Pushgateway |
| GPU SM utilisation | 70-85% | DCGM_FI_DEV_GPU_UTIL |
| Training job success rate | > 99% | Kubernetes job metrics |
| NVLink bandwidth | Within 10% of baseline | DCGM_FI_DEV_NVLINK_BANDWIDTH_TOTAL |
Step 3: Use the Right Tools
- DCGM Exporter -> GPU hardware metrics
- OpenTelemetry Collector -> telemetry unification
- Prometheus + Thanos/Mimir -> long-term storage
- Grafana -> visualisation
None of these are exotic.
All are open source.
The integration work is real, but it's a one-time cost — and it's yours to own, not rented from a SaaS vendor.
The Uncomfortable Truth
If your AI model fails and you can't explain why within thirty minutes, you don't have an optimal production AI setup.
Without deep observability, you risk running a system that looks like production from a distance, but lacks the visibility needed when failures occur.
Because when things break at 3 in the morning, you want a diagnosis in your terminal.
Not another panel to squint at.
Start With the Foundation Already Built
Step 1 is the boring half, and it has to exist before a single GPU metric means anything. KubeAid is that half, already built: standard kube-prometheus and Grafana, configured per cluster in Jsonnet and reconciled by ArgoCD from Git.
It doesn't ship DCGM. You still add the GPU layer yourself, onto a Prometheus that already works.
Or Don't Take the 3 AM Page Yourself
If the honest answer is that your team shouldn't be doing NVLink forensics at 2:47 AM, Obmondo runs Kubernetes as a managed service with 24/7 SRE cover.
Same open-source stack. No lock-in. If you leave, you keep it.